dr-cabal: See README for more info
CLI tool for profiling Haskell dependencies build times. See README.md for more details.
[Skip to Readme]

Modules
[Index] [Quick Jump]
Downloads
- dr-cabal-0.1.0.0.tar.gz [browse] (Cabal source package)
- Package description (as included in the package)
Maintainer's Corner
For package maintainers and hackage trustees
Candidates
- No Candidates
| Versions [RSS] | 0.0.0.0, 0.1.0.0, 0.2.0.0 |
|---|---|
| Change log | CHANGELOG.md |
| Dependencies | aeson (>=2.1 && <2.2), aeson-pretty (>=0.8.9 && <0.9), ansi-terminal (>=0.11 && <0.12), async (>=2.2 && <2.3), base (>=4.15 && <4.17), bytestring (>=0.11 && <0.12), colourista (>=0.1 && <0.2), dr-cabal, optparse-applicative (>=0.17 && <0.18), relude (>=1.1 && <1.2) [details] |
| Tested with | ghc ==9.2.4, ghc ==9.0.2 |
| License | MPL-2.0 |
| Copyright | 2022 Dmitrii Kovanikov |
| Author | Dmitrii Kovanikov |
| Maintainer | Dmitrii Kovanikov <kovanikov@gmail.com> |
| Uploaded | by shersh at 2022-08-07T13:56:04Z |
| Category | Profiling, Development |
| Home page | https://github.com/chshersh/dr-cabal |
| Bug tracker | https://github.com/chshersh/dr-cabal/issues |
| Source repo | head: git clone https://github.com/chshersh/dr-cabal.git |
| Executables | dr-cabal |
| Downloads | 357 total (11 in the last 30 days) |
| Rating | (no votes yet) [estimated by Bayesian average] |
| Your Rating | |
| Status | Docs uploaded by user Build status unknown [no reports yet] |
Readme for dr-cabal-0.1.0.0
[back to package description]dr-cabal
![]()

![]()
dr-cabal is a CLI tool for profiling Haskell dependencies build times.

ℹ️ DISCLAIMER: This project is developed and maintained in free time by volunteers. The development may continue for decades or may stop tomorrow. You can use GitHub Sponsorship to support the development of this project.
Install
dr-cabal is a Haskell CLI tool and can be installed either from
Hackage or from this repository.
Prerequisites
To start using dr-cabal, make sure you have the required version of
cabal-install (a Haskell build tool) and GHC (a Haskell compiler)
installed:
Hackage
To install the latest version of dr-cabal from
Hackage,
follow these steps:
-
Update Hackage index:
cabal update -
Build
dr-cabalfrom Hackage and copy the resulting executable into the desired location:cabal install dr-cabal \ --install-method=copy \ --overwrite-policy=always \ --with-compiler=ghc-9.0.2 \ --installdir=$HOME/.local/bin
ℹ️ NOTE: Make sure the
$HOME/.local/bindirectory or the directory of your choice is listed in$PATH.
Sources
To build the latest version of dr-cabal from sources,
follow these steps:
-
Clone this repository:
git clone https://github.com/chshersh/dr-cabal.git cd dr-cabal -
Build the package:
cabal build -
Copy executable to the desired location:
cp $(cabal list-bin exe:dr-cabal) ~/.local/bin/dr-cabal
ℹ️ NOTE: Make sure the
~/.local/bindirectory or the directory of your choice is listed in$PATH.
How to use?
dr-cabal usages comprises two steps:
- 👀 Watching
cabal buildoutput and recording data into a JSON file. - 🌈 Producing pretty profiling results.
Watch
⚠️ WARNING: To get meaningful results, the
dr-cabal watchcommand needs to be run when none of the dependencies are build. If you've already build you project, including dependencies, you can purge global Cabal cache using the following command:rm -rf ~/.cabalYou may prefer a less invasive approach if you have custom global Cabal configurations:
rm -rf ~/.cabal/storeHowever, with the latter solution you won't see the
Downloadingphase in the profiling output.
Run the following command inside the project directory, for which you want to build the profile chart:
cabal build all | dr-cabal watch --output=dr-cabal-debug.json
This command watches the cabal build output and records all the
relevant steps in the dr-cabal-debug.json file.
If everything is good, you should see output similar to the below one:

It's also possible to see the time spent on Haddock. You can run with:
cabal build all --enable-documentation --haddock-all | dr-cabal watch --output=dr-cabal-debug.json
Profile
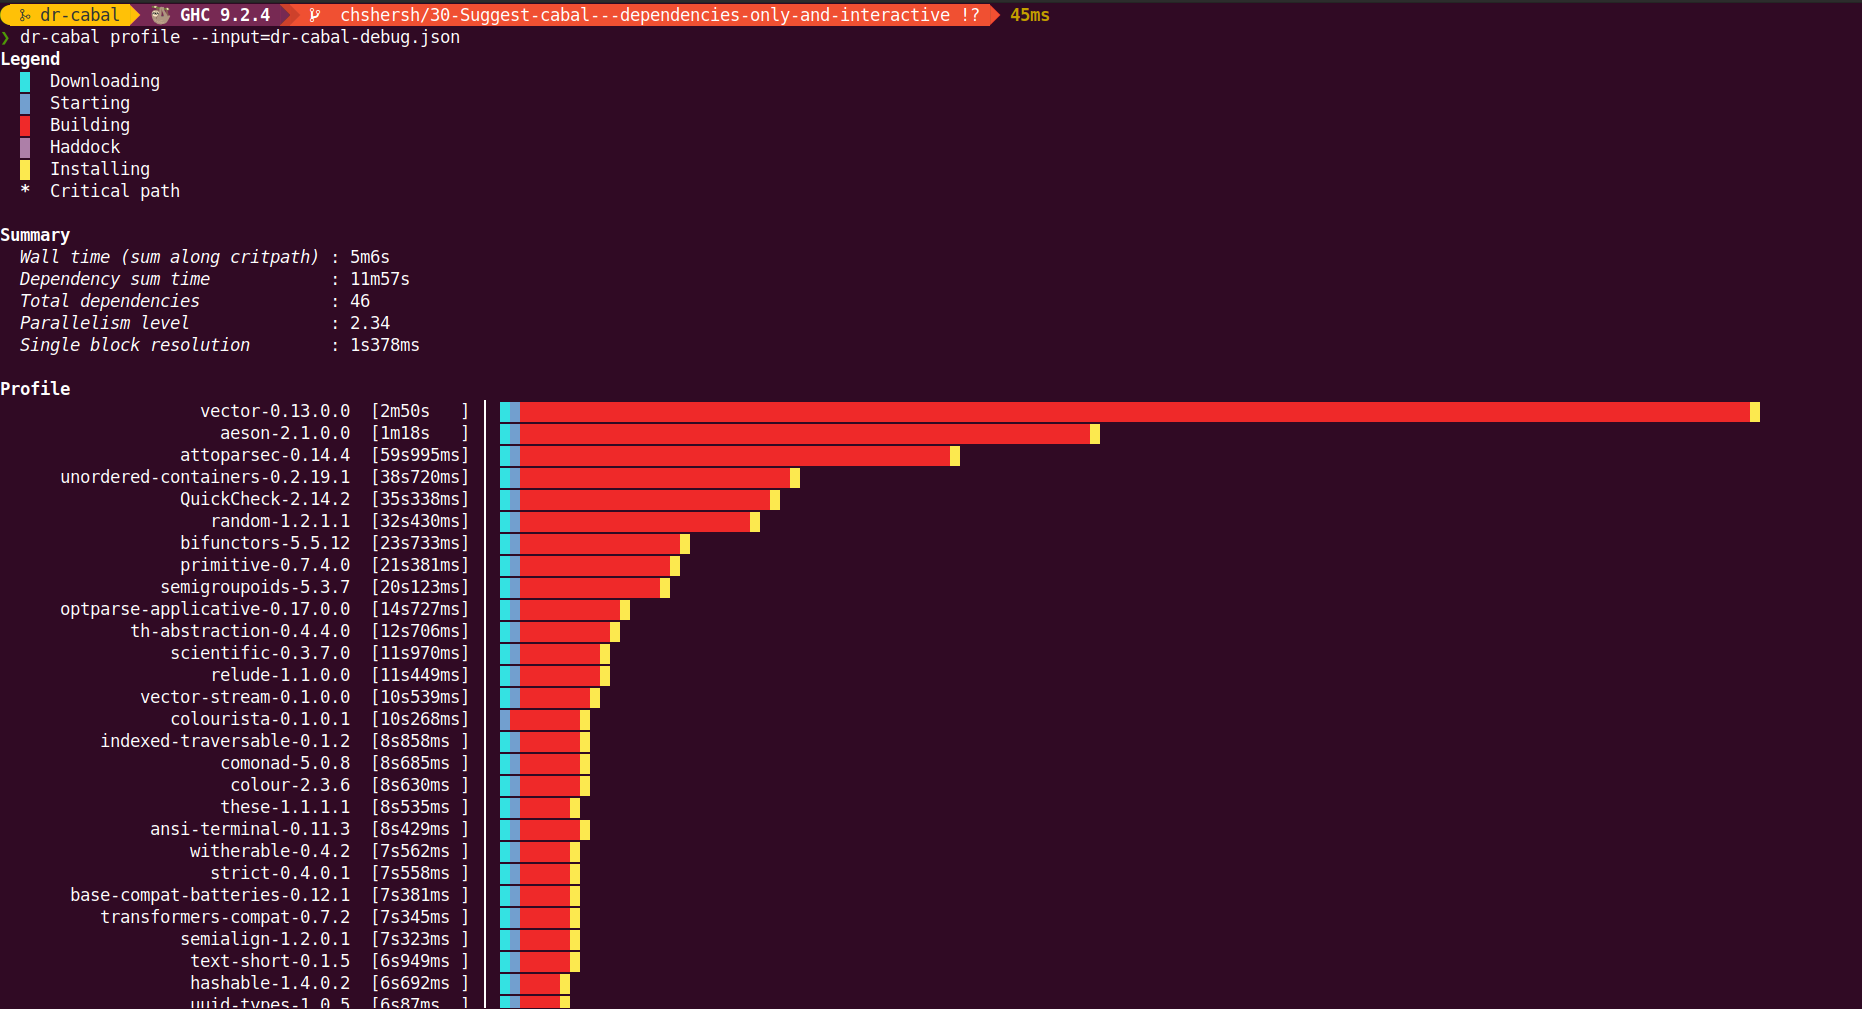
Once you successfully produced a JSON file with all the recorded steps, run the following command to pretty-print the profiling output:
⚠️ WARNING: For better results, make your terminal full-screen.
dr-cabal profile --input=dr-cabal-debug.json
You'll see the output like on the image below: